- HX Daily
- Posts
- HX Weekly: November 17 - November 21, 2025
HX Weekly: November 17 - November 21, 2025
Stock Market Coal for Christmas?

Hello reader, welcome to the latest issue of HX Weekly!
Each week we bring you a new edition of HX Weekly that includes three distinct sections.
In the first section, Thoughts on the Market, we'll offer insights into current economic and market news.
In the second section, HX Daily Redux, we'll revisit investing concepts, tactics, and more from past issues of HX Daily.
And in the third section, Market Wizard’s Wisdom, we’ll share thoughts, quotes, and theories from the greatest investing minds of all time.
Now, let's dive in!
Thoughts on the Markets
A Lump of Stock Market Coal for Christmas?
Well, it certainly is not fun out there for most investors right now.
Even though the S&P 500 is only -5% off of the all-time high reached in late October, the most speculative areas of the stock market are much lower.
Leading cryptocurrencies Bitcoin and Ethereum are down -31% and -43% from highs just set a few months ago.
The areas of the greatest speculation in the stock market like quantum computing, nuclear small-modular-reactors (SMRs), critical minerals, and others are down as much as -50%.
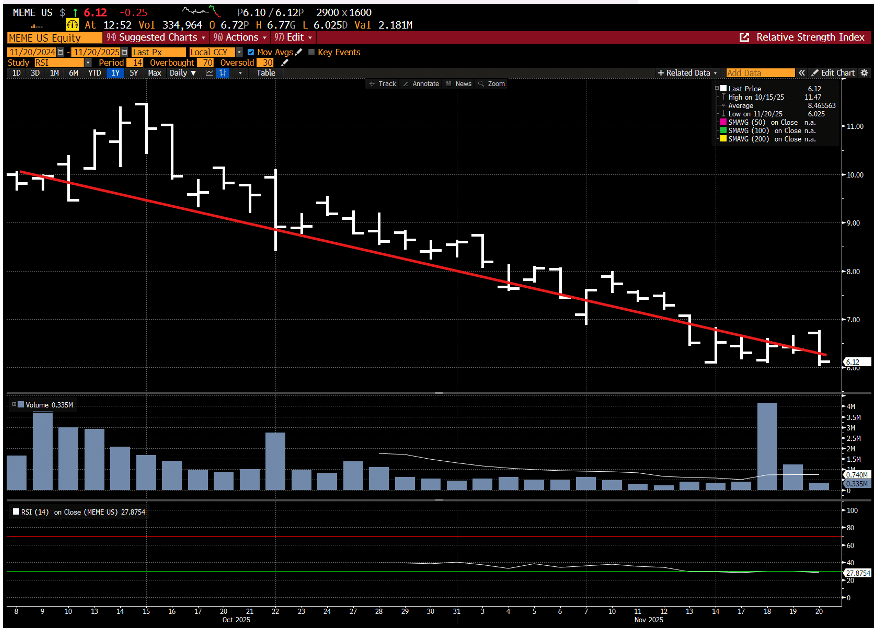
Demonstrating once again that the market is a great indicator of sentiment, remember that ETF operator Roundhill re-introduced it’s Roundhill MEME Stock ETF on October 8, 2025. This was after it was previously shutdown in late 2023.
Here is a chart of how it has performed since the reintroduction…
Here is a list of the top holdings of the ETF…
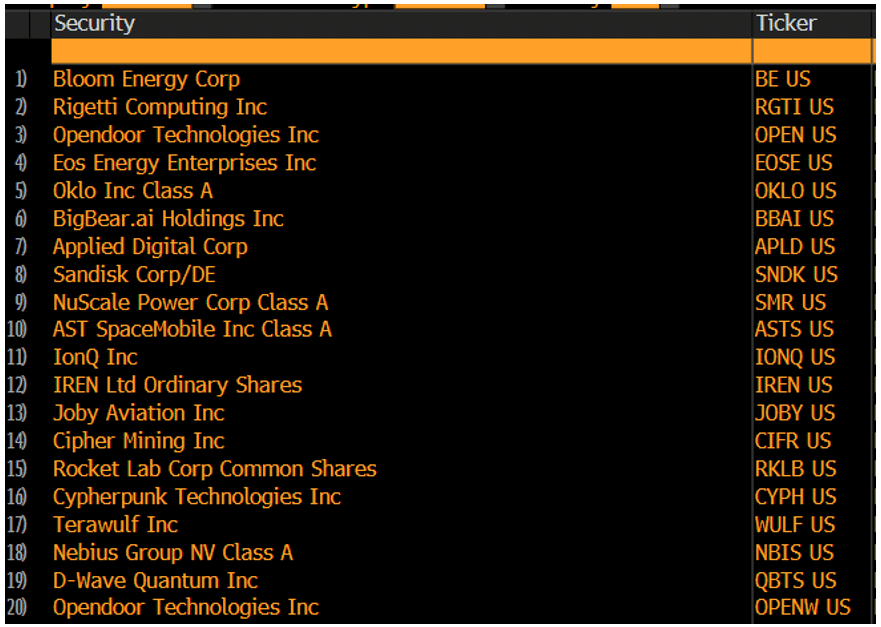
On average these stocks are down almost -50% in the last month!
This is after many of these stocks were +100%, +200% or as much as +500% in the preceding months.
This is one of the reasons it feels so terrible out there.
The reason these stocks were up so much is because so many people had rushed into them. The rush OUT is not only contributing to the dramatic falls in the stocks but also to the pummeling market sentiment.
Even after NVIDIA Corporation (NVDA) reported legit awesome results, the stock market continues to struggle.
Is the BULL market that began three years ago officially coming to an ignominious end?
Well, as Benjamin Graham once said, “In the short run, the market is a voting machine but in the long run, it is a weighing machine.”
A month ago, the votes were for a speculative melt-up. Now, the votes are for a stock market crash.
What does the WEIGHT of the evidence say?
Let’s start by taking a look at the technical picture.
We always like start by asking yourself if the long-term charts of the stock market indices are holding up? Are we in a BULL market trend or a BEAR market trend?
Here is the chart for the S&P 500…
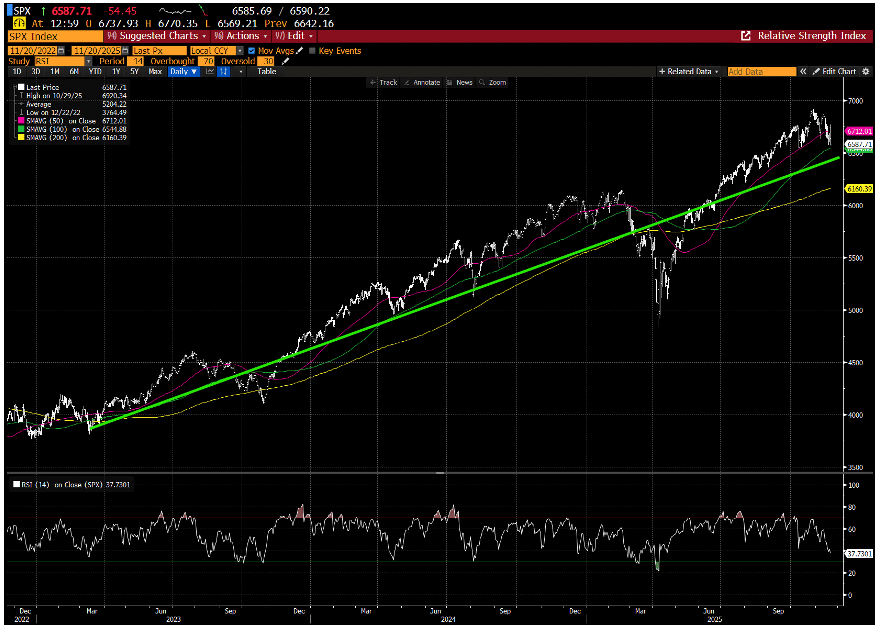
While it recently traded below the 50-day moving average after an extended period above it, it remains strongly it in its uptrend.
Here is the chart of the NASDAQ Composite…
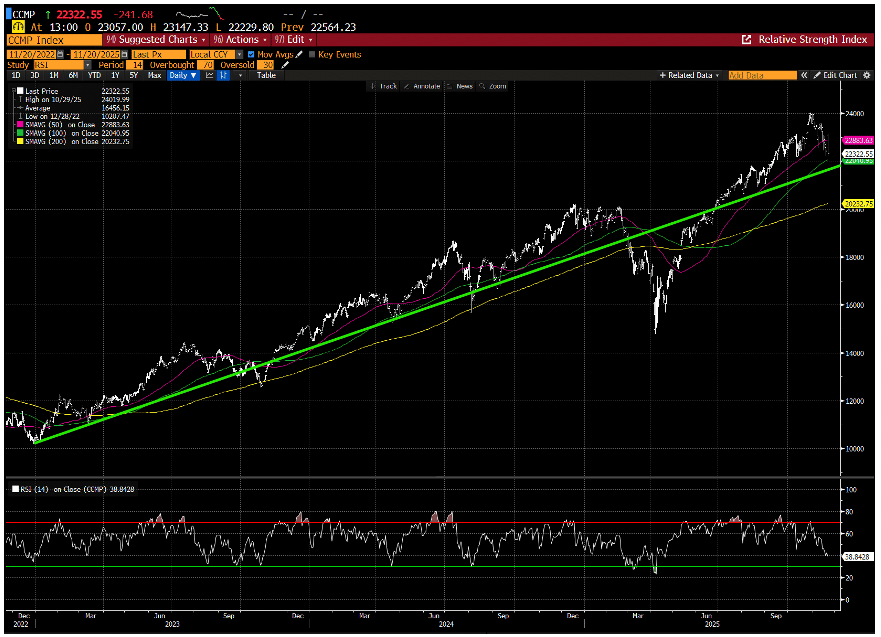
This is the same chart. Both are still above their 100-day moving averages.
Both could trade to their long-term trend lines about -3% to -5% below current levels and still have awesome charts.
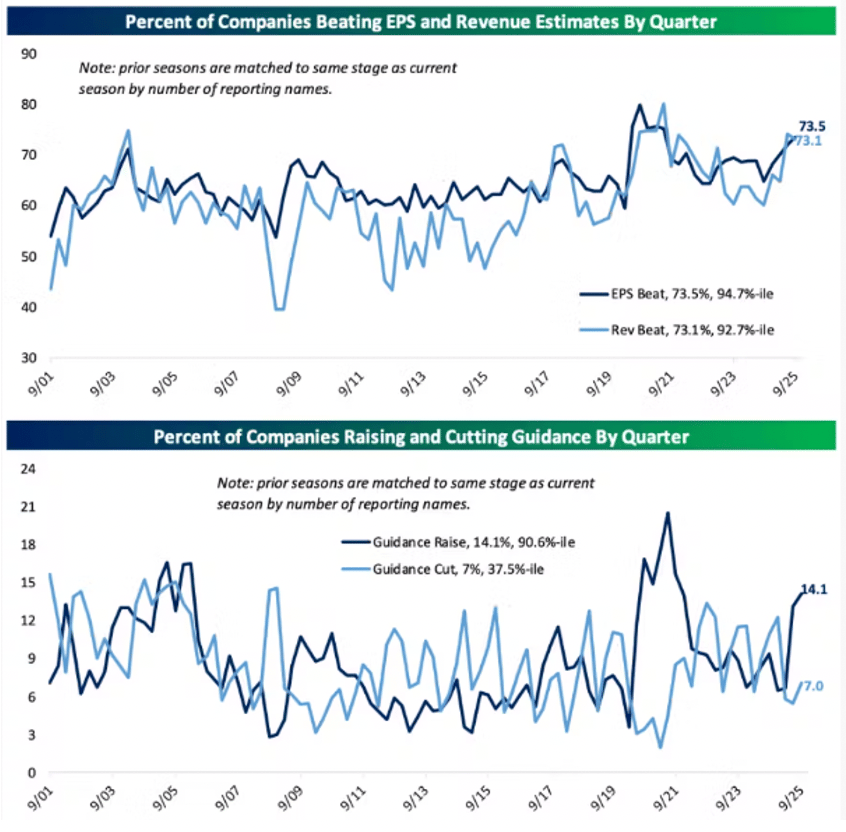
Remember that the biggest driver of stock prices are earnings.
How was this most recent earnings season?
It has been exceptional. Here are some charts from Bespoke Investment Group…
This ranked as a 90%+ percentile performance on beats for both EPS and revenue as well as for raises in guidance. This is NOT bad data.
Perhaps investors are concerned about investor rates?
High rates could hurt stock prices. They certainly did in 2022.
Here is the chart of the yield on the US Government benchmark 10-year bond…
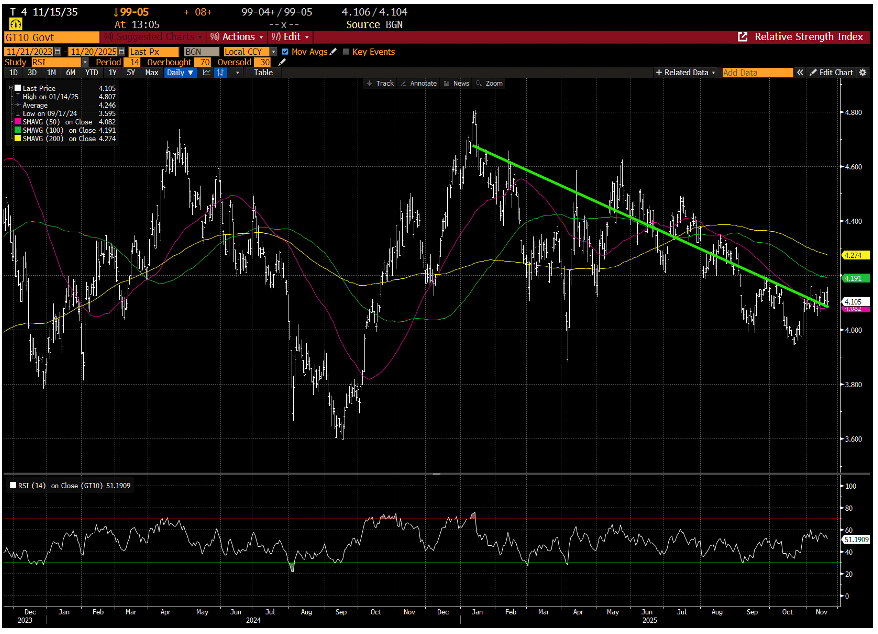
Recently there have been concerns that the Federal Reserve might not cut in the upcoming December meeting, but rates have been trending lower now for a year.
We can argue about how much they might go down and how fast, but with current Federal Reserve Chairman Jerome Powell out next year, we are confident they are going down.
Here is another chart we think is important to think about when thinking about the U.S. stock market…
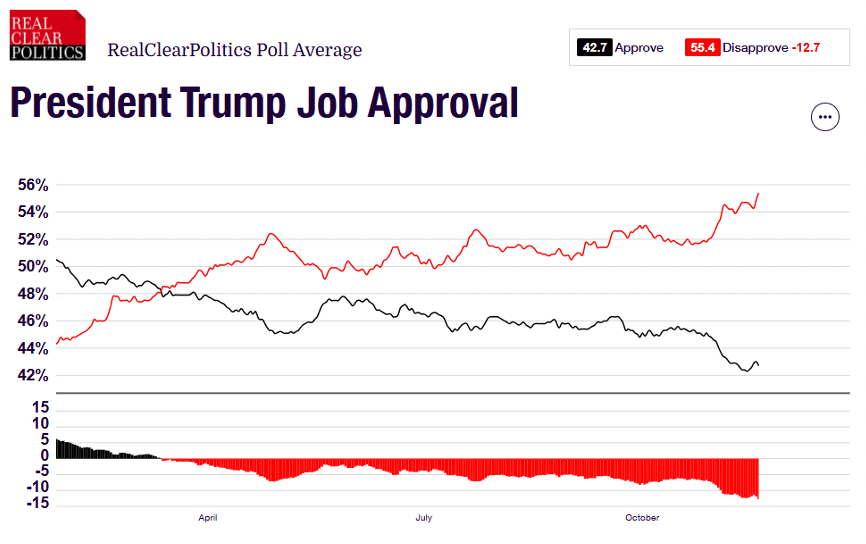
This is the chart of President Trumps approval (black line) versus disapproval (red line) rating.
This clearly is going one way – down.
After the most recent elections, it appears that the many controversial Trump policies are putting pressure on his political standing.
How do you think he will react?
Our view is he will do EVERYTHING he possibly can to try to improve these ratings going into next year’s crucial mid-term elections.
These were some headlines from the last week…
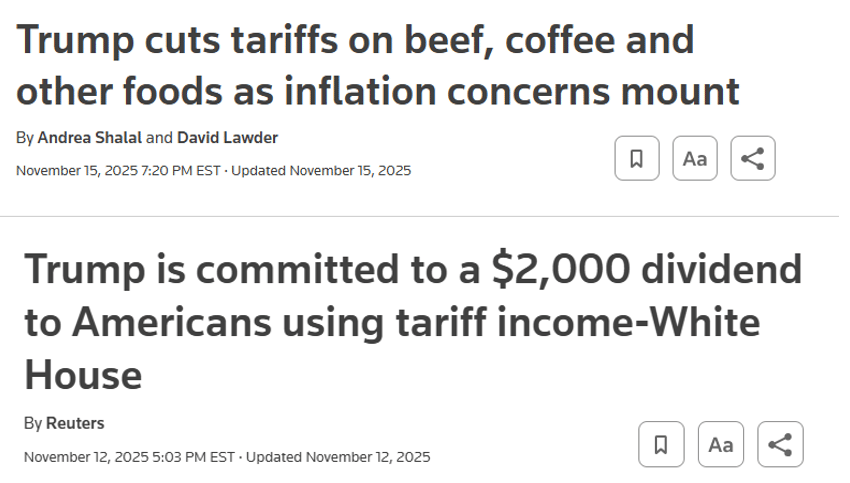
We aren’t arguing whether either of these are good or bad policy.
What we strongly feel, however, is that he is going to do everything he can to drive down inflation and put more money in consumer pockets.
That will NOT be bad for stock prices.
One last chart. Here is the chart of crude oil prices…
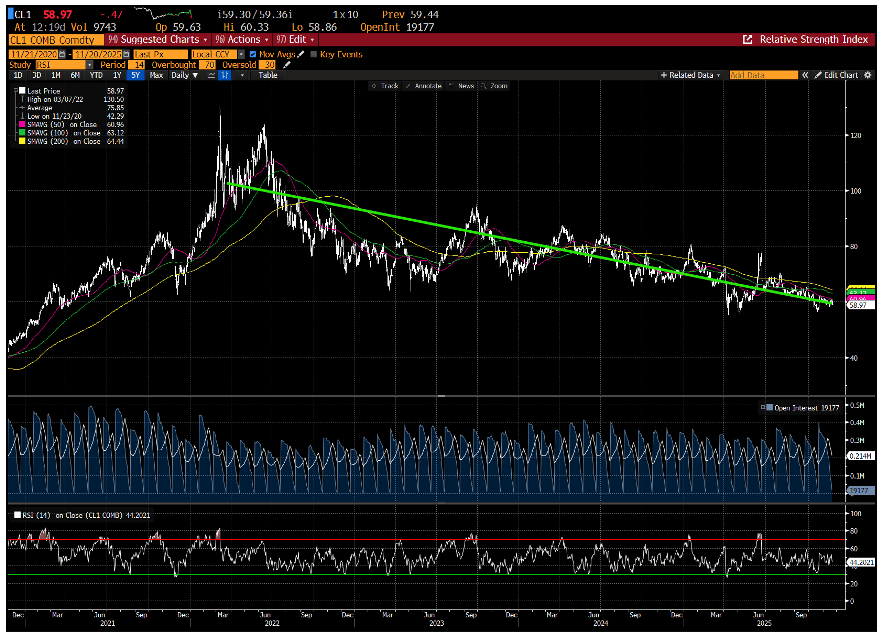
There is a CLEAR trend here…LOWER.
In fact, oil prices are down almost -40% since just last September.
Have you been seeing all of this talk about regime change in Venezuela?
We think it is VERY real and has to do with one – and only one – reason…OIL.
President Trump has said he wants prices lower and most analysts think this is below $50 or even $40 per share.
Venezuela has the largest reserves on Earth and is only a 5-hour flight from Houston, TX.
If the charts remain in uptrends, earnings are great, rates, tariffs and oil prices are all headed lower AND Trump sends a $2000 check out to most Americans – do YOU think we are on the verge of the next BEAR market?
We do not.
BTFD.
HX Daily Redux
The Most Important EPS Report Ever!
NVIDIA Corporation (NVDA) reported earlier this week and here is a note we ran around the time of this same report last year. Our conclusions remain the same.
Enjoy the note!
Over the last week, you have heard many superlatives about yesterday's NVDA earnings report.
The financial commentators and press have been pushing the idea that this is the most important earnings report and company in the stock market—one of the quarter's most important (if not THE most critical) events.
Was it as important as everyone says it is?
There is no doubt that NVDA is a big part of the stock market performance right now. It is the largest component of the S&P 500 at almost a 7% weighting.
It is also the largest component in the NASDAQ at an 8% weighting and over 20% of the semiconductor index.
It is also rightly considered the “bell weather” of the artificial intelligence (“AI”) trend that is key to the recent upward move in stocks.
In our thirty-year career, we have rarely, if ever, seen a stock garner this much attention.
The closest we can recall is the time of the Internet Bubble in the late 1990s. Back then, Cisco Systems, Inc. (NASDAQ: CSCO) was similarly considered a bell weather of the internet build-out.
The entire trading floor would fall silent as the initial results came out after the stock market's close.
It was a much different period back then, though, as our access to media was a fraction of what it is today. We have one hundred times, if not one thousand times, more access to information now.
We think the positioning of NVDA and its importance to the stock market is similar to those stocks. It feels more significant because of the magnification effect of modern digital media, but it also plays a similar role.
We think that looking back at what happened to those stocks and the stock market overall can also give us a good framework for what could happen in the next couple of years.
CSCO was a tremendous stock during the late 1990s and peaked in early 2000. From there it fell precipitously. CSCO has yet to see the high it saw back then.
Was the market wrong about the future of the Internet?
Obviously, the answer is "no." If anything, the market underestimated the impact tenfold.
What happened was that the excitement in the stocks was well ahead of the reality of the earnings.
This excitement also played out in the real economy. Spending on fiber infrastructure, networking equipment, and internet start-ups accelerated economic growth.
The issue, though, was there was too much infrastructure built too fast. They built a giant network that would eventually be used (and increased one hundred-fold), but in the early 2000s, there was too much capacity and insufficient demand.
When this happened, sales for companies like CSCO plummeted, as did their earnings and stocks.
What happened to the stock market?
If you look at the major stock market indices in 2000, you will see a bad year. The S&P 500 was -9%, and technology-heavy NASDAQ Composite was down almost -37%. Terrible.
Technology stocks had become a huge part of the indices – almost as big as they are today. When they fell, it dragged the entire stock market down.
Did you know, though, that in the year 2000, more stocks in the S&P 500 were UP than down?
The equal-weighted index was +9% for the year.
While it was a terrible year for the stock market indices, it was one of the best years ever for stock pickers. As technology crumbled, the rest of the market saw a strong rally.
This is something we think we can see happen again.
Without a doubt, NVDA is essential to one of the strongest trends driving this particular BULL market.
That is only ONE of the trends, though, in the market. There are many other drivers.
When the AI investment cycle slows down materially (and it is a “when”) it may or may not slow down the whole economy. We shall see…
For now, NVDA is an important piece of the stock market "mosaic," but it is still only a piece.
Market Wizard’s Wisdom
Poor Charlie’s “Mental Models” – Part Two
Two weeks ago, we shared several of Charlie Munger’s “mental models.”
While we are very familiar with Munger's wit and wisdom, we had not read about these until we saw a note from our colleague Sean Ring of The Rude Awakening.
He introduced us to these “mental models” in a recent piece.
As Sean says, these are “…guiding principles and ways of thinking that he’s (Munger) curated from a broad spectrum of disciplines. Munger’s approach isn’t about memorizing facts or executing rigid strategies but constructing a ‘latticework of mental models’ that integrate knowledge from psychology, economics, biology, and other fields to make better decisions.”
By the way, you can sign up for Sean’s great free email newsletter here.
As we said two weeks ago - we loved the mental models Sean shared in his piece, and we will share some more of them with you today.
Here are some of Munger’s “mental models” …
1. Second-Order Thinking
This is the concept that when we consider the impact of an action or decision, we often only consider what is likely to happen next. It is difficult for us to consider the greater ramifications.
This can have significant impacts on trading and investing.
A change in commodity prices might impact one of your holdings in a certain way. Looking beyond the initial reaction might lead to the conclusion that it affects it in the exact opposite way.
Getting this wrong can lose you a lot of money.
We spoke about a version of this concept in our recent note about legendary investor Howard Marks. You can read that note here.
2. The Map Is Not the Territory
We had never heard this saying before, but Munger is making the point that no matter how well thought out a model might be, it doesn't represent reality.
No matter how sophisticated the model is, we cannot 100% capture the complexity of the real world.
A dangerous outcome related to this insight is what is called "false precision."
When we make decisions based on the result of a "model" without accepting it, we may be wrong. More data does NOT mean more accuracy.
3. Mr. Market
This is a clever term coined by the father of value investing – Benjamin Graham.
"Mr. Market" is a fictional character Graham created to illustrate that markets are emotional and volatile by nature. After all, they are made up of humans!
Much of Graham's (and Munger's) work is based on the idea that fundamentals drive ultimate stock prices. We don't always agree, but the concept of "Mr. Market" was their acknowledgment of human emotion's role in asset prices.
This is a powerful concept in psychology.
We feel better about making a decision or taking an action when we see our peers doing the same. This is the key to herd mentality and the creation of asset bubbles.
When we see everyone else buying a winning growth stock (that is going up), we feel good about buying it as well. Regardless of what our analysis might tell us.
This brings up the old stock market adage about money management – “No one ever got fired for buying IBM.” Today’s version might be NVIDIA instead…
5. Occam’s Razor
This is one of our favorites. "Occam's Razor" states that when given a range of potential explanations for something, the simplest and most straightforward is the most likely.
We think this is true in most things in life.
It is also one of the more challenging insights for "sophisticated" investors to accept. The most straightforward answer seldom sounds the smartest.
Many (most) professionals are more interested in sounding smart than being right.
Remembering "Occam's Razor" when doing your analysis can give you a leg up on them!
We hope that you’ve enjoyed this week’s issue of HX Weekly…
What did you think of today's HX Weekly?Your feedback helps us create the best newsletter possible. |
Do you have any thoughts, questions, or feedback? Tell us more in the comment section or at [email protected].
Reply